Empowering CFOs in data-driven organizations
CFOs are key in data-driven SMBs, bridging finance and data. Tools like Patterns help them make quick, informed decisions for business success.
Chris Stanley
·
June 21, 2024

Today's employees and customers are looking for business leaders experienced with data, increasingly turning to finance teams to drive those insights. They expect leaders to understand their businesses’ financial health and back that up with informed metrics. For larger companies, this data is often managed by analysts and data teams reporting to a Chief Financial Officer (CFO), who surface insights at the direction of their leadership teams. They’re solving significant problems with big data and dedicating substantial teams to do so.
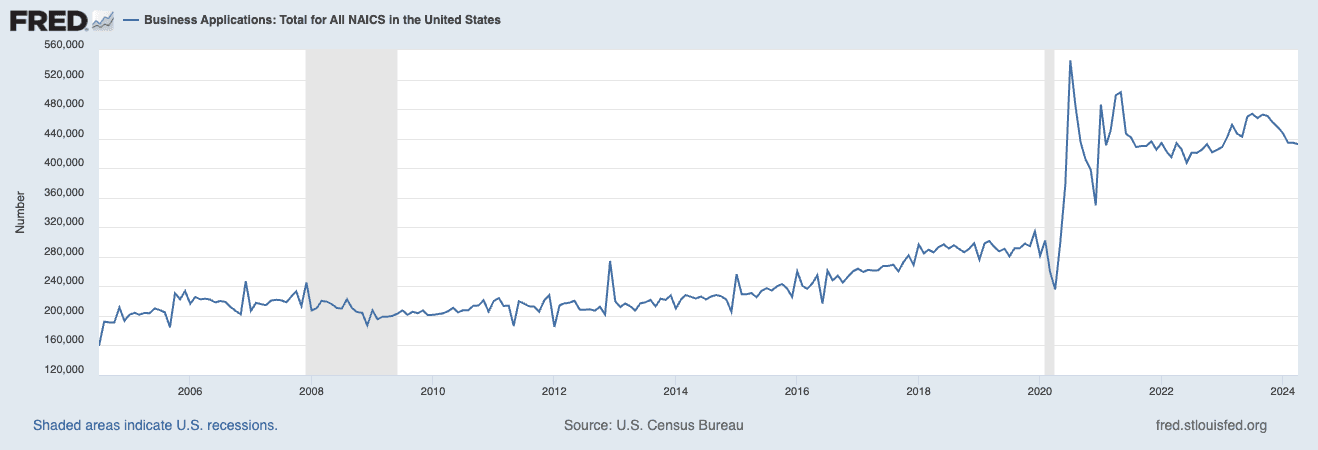
However, not all businesses are big enough to dedicate entire teams to data analysis. According to the Federal Reserve Bank of St. Louis, new business applications are at an all-time high, and many of these businesses will not have the revenue to afford entire leadership and data teams. While these companies may be small now, the problems they’re addressing are anything but small. They could benefit from the expertise a CFO brings.
The evolution of the CFO as a data leader
The role of the Chief Financial Officer has evolved significantly. Managing a company’s finances remains their primary responsibility, but what that entails is much more complicated than financial reporting and planning. Many CFOs find themselves more embedded in their data teams, helping them understand and drive business strategies through informed, data-driven decisions.
Modern CFOs now sit at the intersection of finance and data, navigating traditional financial problems while understanding the complex data environments driving their businesses. This unique position in the C-suite requires them to be both guardians of fiscal health and drivers of insights that guide the company’s overall strategy.
CFOs are doing this out of necessity. Abhinav Swarup, Vice President of Finance at Zeus Living, described this problem to Nasdaq in 2023:
“These business leaders are hired to do what is best for their divisions and execute on their individual priorities. Due to this focused nature of work, they rely on finance leaders to guide them on the impact of their initiatives both cross-functionally and at the company level. And in order to provide this guidance it is imperative for the finance leaders to have accurate and timely data.”
And Clair Bramley, CFO of Teradata, defined the need for data in her role to McKinsey & Company in 2024:
“We do a lot of work with data and analytics to consider potential different outcomes and the different ways we could approach planning depending on what happens with our customers and what they need—for example, depending on what happens in the macro environment.”
In practice, CFOs and their teams take on more analytical tasks than ever. They’re embedding themselves in product teams to inform their financial forecasting and models better. They’re building dashboards and repeatable analyses to report on the state of the business. They’re creating informed KPIs that connect what’s happening directly to the company's financial performance.
Empowering CFOs With Data in Leaner Organizations
That’s a lot of work for a CFO and their team, even in a large company. What happens when the data team is small or doesn’t even exist? The questions a CFO tries to answer with data are complex and large in scale. They need tools that empower them to answer questions quickly with the limited time they have.
Patterns can be one of those solutions, especially for bespoke analyses on a database. A CFO can spend less time wrestling with SQL and more time analyzing the results, freeing them up to act on those insights in typical CFO tasks such as forecasting and modeling.
Here are a few analyses that a fractional CFO can look at:
Customer Lifetime Value (LTV)
Customer Lifetime Value (LTV) is a catch-all metric showing the total revenue a business can anticipate from a single customer. It’s typically measured throughout the relationship between a customer and a business.
CFOs can use LTV as a north-star metric to see if their efforts across the business are making an impact. LTV is tied directly to the revenue a customer is expected to bring in. Subsidiary metrics such as activation, retention, and marketing metrics like customer acquisition can all feed into LTF to further inform that number.
LTV is an excellent metric to monitor over time. If a business introduces new products or higher value offerings, it’s reasonable to see that metric tick up. Alternatively, maintaining an LTV over a long period of time could indicate customers are loyal and retaining.
Specifying that we monitor this over time will usually yield a line graph. In this dataset, we had some trial customers before the launch of orders. We were interested in LTV from a specific point forward, in this case, from January 2017 onwards. Our prompt looked like this:
“Can we show how our Customer Lifetime Value has changed over time, starting in January 2017?”
This type of analysis requires a few Common Table Expressions (CTEs) to put together, as we would need to look at a table with all of our customers and groups, and then summing up their orders. A CFO might need more time or the data background to put together such a query. Patterns provided us with this line graph:
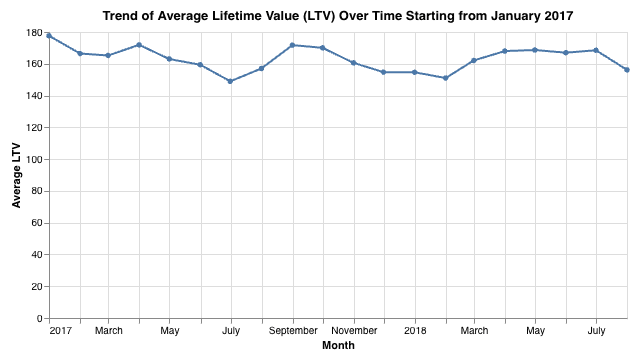
The LTV of our customer base in this data set appears to be between $150 and $180 and looks relatively consistent throughout. September and October 2017 seemed to be where we peaked after launch, which may indicate that a series of product launches or marketing efforts were starting to take hold. It could also suggest that our LTV is subject to some seasonality.
Outlier Detection
Outliers, both above and below the norm, can indicate issues with strategies and systems within an organization that isn’t working as intended. They can reveal irregularities in how a specific product is offered, and knowing where those outliers are can identify places of inefficiency, emerging market trends, or indications of fraud. All are valuable to a CFO.
In this example, we are working with a database containing bank loans over a year. We suspect some seasonal patterns to the amounts of individual loans. We also suspected that groups of large loans, well above the normal bounds, were skewing how much we could expect to loan out on the average loan.
Because we were interested in looking at the upper bounds of this data, we structured our prompt as such:
“Can we create a box plot of loan amounts by month? We're interested in seeing the amount of outliers outside of the 75th percentile”
Box plots are a good, simple visualization for examining distribution and identifying outliers. We structured it by month to identify the seasonality pattern. We specified what we were interested in looking for in terms of outliers, as sometimes box plots only show the upper whisker (typically bound to the highest 25% of users) and omit the outliers. We want to know if there are outliers above that bound.
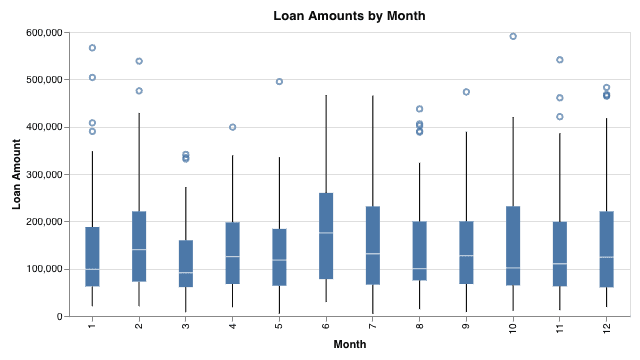
In the plot created by Patterns, we see two trends emerging:
The median loan amount creeps up in the summer months.
The number of large, outlier loans exceeds $400k and are spread out throughout the year.
A CFO of this small bank can use this data to plan out loan disbursements and identify a threshold to pay more attention to.
Other Questions to Consider
With Patterns, a CFO can be more curious about their data. They can wear the many different hats that they’re expected to wear. They can ask questions like:
What are my customers buying the most?
Are my marketing campaigns bringing in the amount of leads I would expect?
Are my customers retaining over time?
How are our employee’s workloads? Do my sales teams have too many/too few leads?
Answering those questions shouldn’t be limited by the database knowledge of a CFO. It also shouldn’t be limited to dedicated data teams, especially when new businesses tackle increasingly more complicated problems. A CFO can lean on a tool like Patterns to fill in that data insights gap when a small business needs those insights the most.
Analytics in natural language
Empowering CFOs in data-driven organizations
CFOs are key in data-driven SMBs, bridging finance and data. Tools like Patterns help them make quick, informed decisions for business success.
Chris Stanley
·
June 21, 2024
Today's employees and customers are looking for business leaders experienced with data, increasingly turning to finance teams to drive those insights. They expect leaders to understand their businesses’ financial health and back that up with informed metrics. For larger companies, this data is often managed by analysts and data teams reporting to a Chief Financial Officer (CFO), who surface insights at the direction of their leadership teams. They’re solving significant problems with big data and dedicating substantial teams to do so.
However, not all businesses are big enough to dedicate entire teams to data analysis. According to the Federal Reserve Bank of St. Louis, new business applications are at an all-time high, and many of these businesses will not have the revenue to afford entire leadership and data teams. While these companies may be small now, the problems they’re addressing are anything but small. They could benefit from the expertise a CFO brings.
The evolution of the CFO as a data leader
The role of the Chief Financial Officer has evolved significantly. Managing a company’s finances remains their primary responsibility, but what that entails is much more complicated than financial reporting and planning. Many CFOs find themselves more embedded in their data teams, helping them understand and drive business strategies through informed, data-driven decisions.
Modern CFOs now sit at the intersection of finance and data, navigating traditional financial problems while understanding the complex data environments driving their businesses. This unique position in the C-suite requires them to be both guardians of fiscal health and drivers of insights that guide the company’s overall strategy.
CFOs are doing this out of necessity. Abhinav Swarup, Vice President of Finance at Zeus Living, described this problem to Nasdaq in 2023:
“These business leaders are hired to do what is best for their divisions and execute on their individual priorities. Due to this focused nature of work, they rely on finance leaders to guide them on the impact of their initiatives both cross-functionally and at the company level. And in order to provide this guidance it is imperative for the finance leaders to have accurate and timely data.”
And Clair Bramley, CFO of Teradata, defined the need for data in her role to McKinsey & Company in 2024:
“We do a lot of work with data and analytics to consider potential different outcomes and the different ways we could approach planning depending on what happens with our customers and what they need—for example, depending on what happens in the macro environment.”
In practice, CFOs and their teams take on more analytical tasks than ever. They’re embedding themselves in product teams to inform their financial forecasting and models better. They’re building dashboards and repeatable analyses to report on the state of the business. They’re creating informed KPIs that connect what’s happening directly to the company's financial performance.
Empowering CFOs With Data in Leaner Organizations
That’s a lot of work for a CFO and their team, even in a large company. What happens when the data team is small or doesn’t even exist? The questions a CFO tries to answer with data are complex and large in scale. They need tools that empower them to answer questions quickly with the limited time they have.
Patterns can be one of those solutions, especially for bespoke analyses on a database. A CFO can spend less time wrestling with SQL and more time analyzing the results, freeing them up to act on those insights in typical CFO tasks such as forecasting and modeling.
Here are a few analyses that a fractional CFO can look at:
Customer Lifetime Value (LTV)
Customer Lifetime Value (LTV) is a catch-all metric showing the total revenue a business can anticipate from a single customer. It’s typically measured throughout the relationship between a customer and a business.
CFOs can use LTV as a north-star metric to see if their efforts across the business are making an impact. LTV is tied directly to the revenue a customer is expected to bring in. Subsidiary metrics such as activation, retention, and marketing metrics like customer acquisition can all feed into LTF to further inform that number.
LTV is an excellent metric to monitor over time. If a business introduces new products or higher value offerings, it’s reasonable to see that metric tick up. Alternatively, maintaining an LTV over a long period of time could indicate customers are loyal and retaining.
Specifying that we monitor this over time will usually yield a line graph. In this dataset, we had some trial customers before the launch of orders. We were interested in LTV from a specific point forward, in this case, from January 2017 onwards. Our prompt looked like this:
“Can we show how our Customer Lifetime Value has changed over time, starting in January 2017?”
This type of analysis requires a few Common Table Expressions (CTEs) to put together, as we would need to look at a table with all of our customers and groups, and then summing up their orders. A CFO might need more time or the data background to put together such a query. Patterns provided us with this line graph:
The LTV of our customer base in this data set appears to be between $150 and $180 and looks relatively consistent throughout. September and October 2017 seemed to be where we peaked after launch, which may indicate that a series of product launches or marketing efforts were starting to take hold. It could also suggest that our LTV is subject to some seasonality.
Outlier Detection
Outliers, both above and below the norm, can indicate issues with strategies and systems within an organization that isn’t working as intended. They can reveal irregularities in how a specific product is offered, and knowing where those outliers are can identify places of inefficiency, emerging market trends, or indications of fraud. All are valuable to a CFO.
In this example, we are working with a database containing bank loans over a year. We suspect some seasonal patterns to the amounts of individual loans. We also suspected that groups of large loans, well above the normal bounds, were skewing how much we could expect to loan out on the average loan.
Because we were interested in looking at the upper bounds of this data, we structured our prompt as such:
“Can we create a box plot of loan amounts by month? We're interested in seeing the amount of outliers outside of the 75th percentile”
Box plots are a good, simple visualization for examining distribution and identifying outliers. We structured it by month to identify the seasonality pattern. We specified what we were interested in looking for in terms of outliers, as sometimes box plots only show the upper whisker (typically bound to the highest 25% of users) and omit the outliers. We want to know if there are outliers above that bound.
In the plot created by Patterns, we see two trends emerging:
The median loan amount creeps up in the summer months.
The number of large, outlier loans exceeds $400k and are spread out throughout the year.
A CFO of this small bank can use this data to plan out loan disbursements and identify a threshold to pay more attention to.
Other Questions to Consider
With Patterns, a CFO can be more curious about their data. They can wear the many different hats that they’re expected to wear. They can ask questions like:
What are my customers buying the most?
Are my marketing campaigns bringing in the amount of leads I would expect?
Are my customers retaining over time?
How are our employee’s workloads? Do my sales teams have too many/too few leads?
Answering those questions shouldn’t be limited by the database knowledge of a CFO. It also shouldn’t be limited to dedicated data teams, especially when new businesses tackle increasingly more complicated problems. A CFO can lean on a tool like Patterns to fill in that data insights gap when a small business needs those insights the most.