Blog
Ensure Financial Accuracy with Patterns' Knowledge Base
Sam Nickolay
·
Sep 16, 2024


Chris Stanley
·
Jun 25, 2024
Introducing Patterns for finance teams
Confused by numbers? Patterns translates your questions into reports across NetSuite & Salesforce. Get AI insights to optimize performance and ditch the spreadsheets!

Chris Stanley
·
Jun 21, 2024
Empowering CFOs in data-driven organizations
CFOs are key in data-driven SMBs, bridging finance and data. Tools like Patterns help them make quick, informed decisions for business success.

Chris Stanley
·
Jun 3, 2024
Patterns for self-serve analytics agents
Patterns empowers users with AI for instant insights beyond dashboards. Explore how its AI uses natural language queries, autonomous data exploration, and intelligent insights.

Chris Stanley
·
Jun 1, 2024
Financial analytics with AI: watch me speed run this dataset
Explore how Patterns improves financial analytics with AI: creates insights, handles complex queries, empowers analysts for rapid data decisions, unlocking growth opportunities.

Chris Stanley
·
Apr 26, 2024
Text to SQL and its uncanny valley
For technical builds, good luck. Non-technical? Need more than text-to-SQL. Text-to-analysis empowers all, technical or not, to work better with data insights.
Chris Stanley
·
Apr 22, 2024
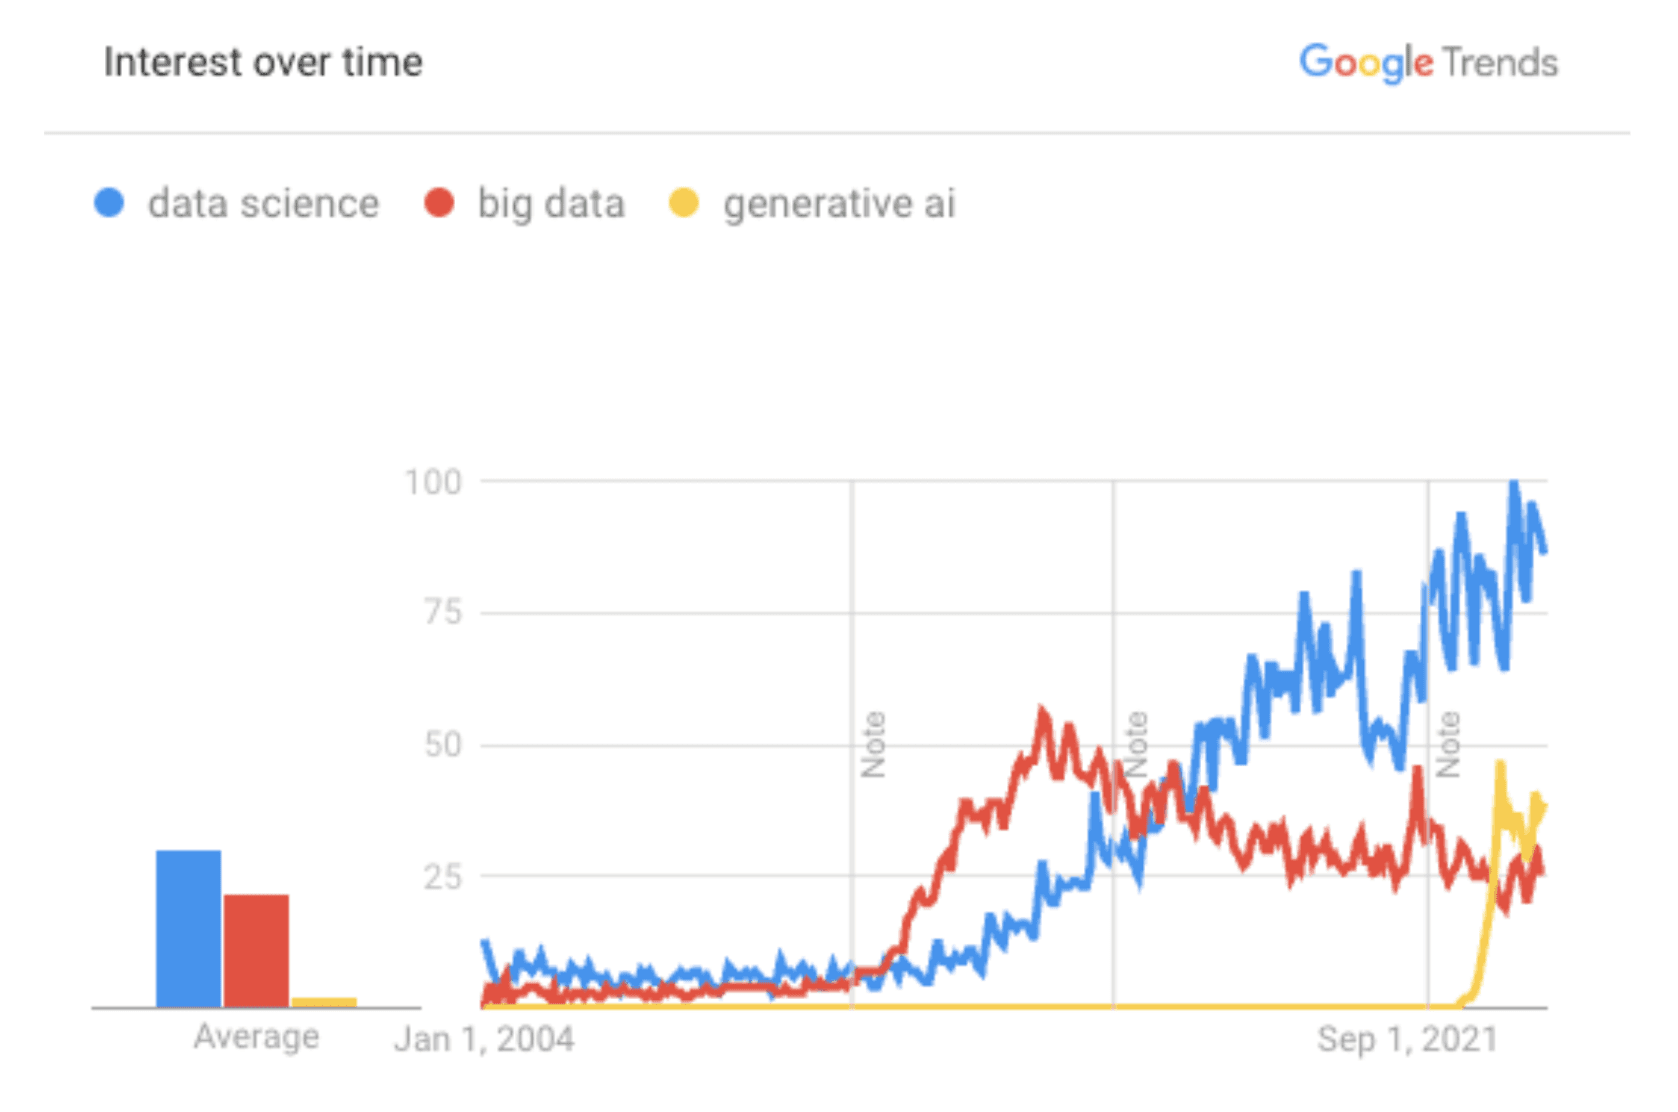
What is an AI data analyst?
Explore how generative AI is reshaping analytics, intriguing professionals with its potential while signaling automation's impact on data analysis roles.

Chris Stanley
·
Apr 9, 2024
Visualizing common product metrics using AI
Discover how AI transforms product management by visualizing essential metrics like user engagement and marketing leads. Tools like Patterns streamline data analysis, enabling swift, strategic decision-making for product managers.
Brett Sheppard
·
Mar 29, 2023
AI flight Patterns
This article explores data visualization's evolution from "Flight Patterns" to Patterns.app's AI capabilities, highlighting its revolutionary impact on analytics through easy visualization and analysis with natural language prompts.

Chris Stanley
·
Mar 29, 2024
AI-generated data visualization examples with Patterns + Vega-Lite
AI revolutionizes data visualization in our blog, showcasing seven AI-generated examples using Patterns and Vega-Lite. Learn to effortlessly create complex visualizations, from startup funding trends in Miami, Austin, and the Bay Area to detailed investment patterns. This guide highlights AI's role in simplifying data analysis, making it accessible for anyone to generate insightful visualizations with ease. Ideal for businesses seeking to leverage their data for actionable insights without deep technical knowledge. See AI's impact on data storytelling.

Chris Stanley
·
Mar 21, 2024
AI agents for decision support and decision augmentation
A comprehensive discussion on the emerging role of Artificial Intelligence (AI) in data analysis, including personalized data delivery, interactive AI analysts, and integration with existing data infrastructure. Covering real-world applications and the future of AI data analysts, it serves as an insightful resource for organizations aiming to leverage AI for data-driven decision-making and business growth.

Chris Stanley
·
Feb 15, 2024
Introducing Patterns
Patterns is a data analytics AI that acts like a knowledgeable coworker, helping users turn data into insights by simulating top analysts and filling data literacy gaps.

Chris Stanley
·
Dec 21, 2023
Nash's operational intelligence bot, Satoshi II
Nash, a logistics tech company, enhanced its operations by implementing an AI bot named Satoshi II. This AI solution, part of the Patterns platform, significantly streamlined data analysis and query handling, boosting operational efficiency and decision-making processes within the company. The introduction of Satoshi II demonstrates the transformative impact of AI tools in optimizing business operations.

Ken Van Haren
·
Jan 18, 2023
Replacing a SQL analyst with 26 recursive GPT prompts
When I was at Square and the team was smaller we had a dreaded “analytics on-call” rotation. It was strictly rotated on a weekly basis, and if it was your turn up you knew you would get very little “real” work done that week and spend most of your time fielding ad-hoc questions from the various product and operations teams at the company (SQL monkeying, we called it). There was ...
Chris Stanley
·
Feb 4, 2024
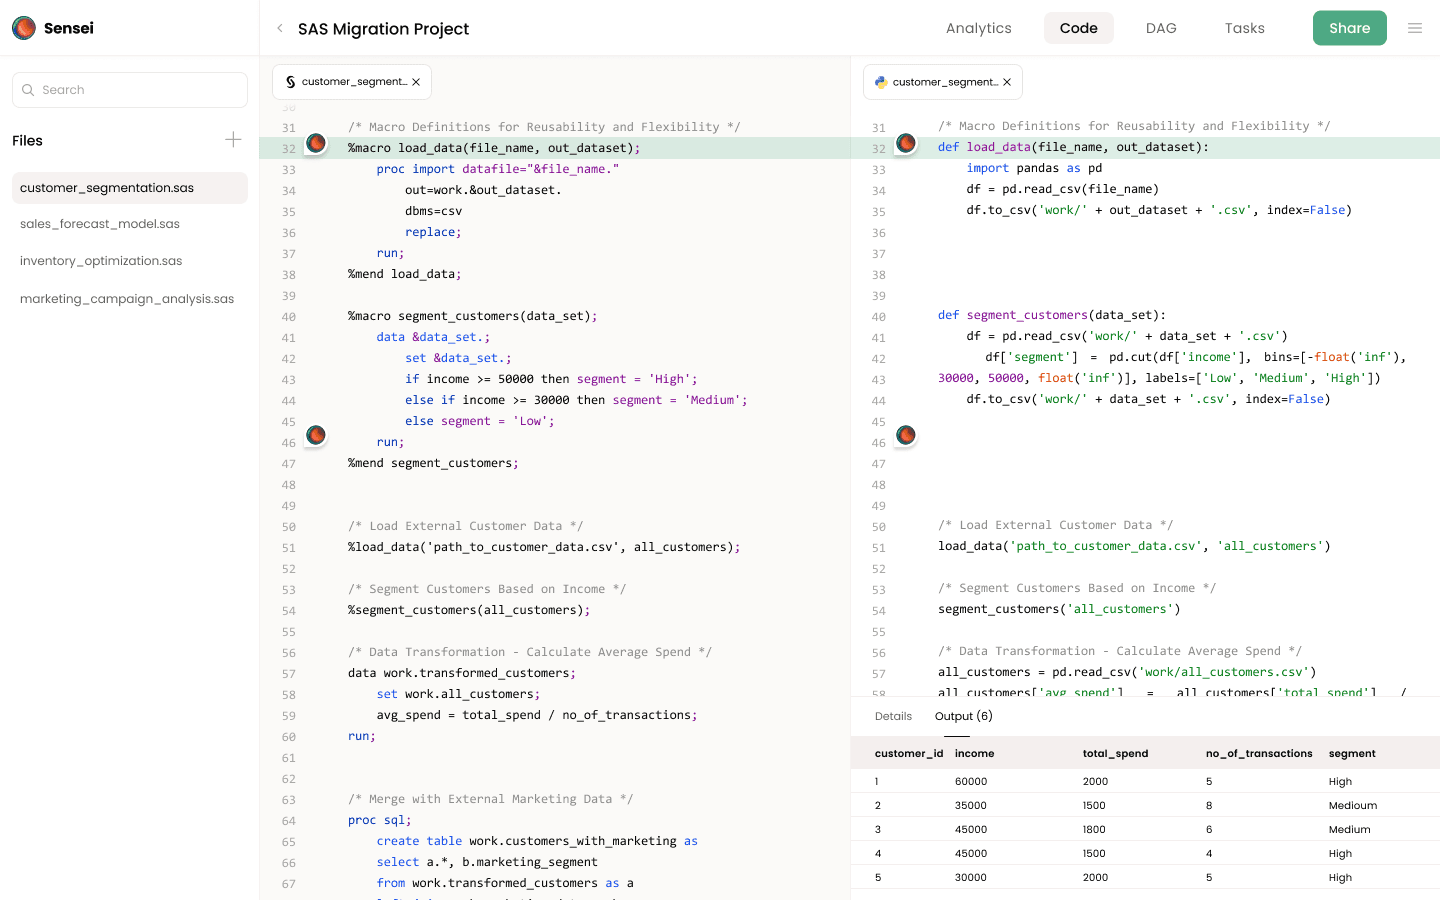
SAS non-linear mixed effects model in Python: a guide
Non-linear mixed effects models have become increasingly popular in various fields, including healthcare, social sciences, and economics. These models allow researchers to analyze complex data structures with both fixed and random effects, while accommodating non-linear relationships between variables. Traditionally, SAS has been the go-to software for fitting these models. However, Python has emerged as a powerful alternative, offering a rich ecosystem of libraries and tools for statistical modeling. In this blog post, we will explore the process of transitioning from SAS to Python for non-linear mixed effects models, with the help of Sensei, a tool designed to facilitate this transition.
Chris Stanley
·
Jan 14, 2024
Generate an investor-grade data room in 90 minutes with GPT4
Turn a basic database into an attractive showcase for investors with Patterns, a generative analytics tool. See how AdventureWorks, a fictional bicycle company, transformed their simple 92-table database into a comprehensive data suite in just 90 minutes. The process involves outlining research, generating specific data requests, analyzing with AI, and sharing insights through platforms like Google Sheets, dashboards, or slide decks.