Generate an investor-grade data room in 90 minutes with GPT4
Turn a basic database into an attractive showcase for investors with Patterns, a generative analytics tool. See how AdventureWorks, a fictional bicycle company, transformed their simple 92-table database into a comprehensive data suite in just 90 minutes. The process involves outlining research, generating specific data requests, analyzing with AI, and sharing insights through platforms like Google Sheets, dashboards, or slide decks.
Chris Stanley
·
January 14, 2024

This blog is for anyone looking to generate a ton of data intelligence on their company in a very short amount of time. I demonstrate how to do this using Patterns, our generative analytics product, and a series of prompts to create a comprehensive analytics suite. Our goal? To turn a basic database into an insightful, investor-attracting data showcase.
Our case study centers on AdventureWorks, a fictional company in the bicycle retail and manufacturing sector. We started with their straightforward 92-table production Postgres database, encompassing tables like orders, products, and employees. Within 90 minutes, we transformed this raw data into nearly 50 insightful analyses. So tell me, would you invest in AdventureWorks?
Discover the Results:
Click here to view the AdventureWorks generated data room (also embedded below)
Sign up here to demo Patterns with the AdventureWorks AI Analyst
Steps to prompt a data room
Generate a research outline
Use your outline to generate specific requests
Use your specific requests to generate the actual analyses
Synthesize and serve the analyses via AI chat or reports
Step 1 - Generate a research outline
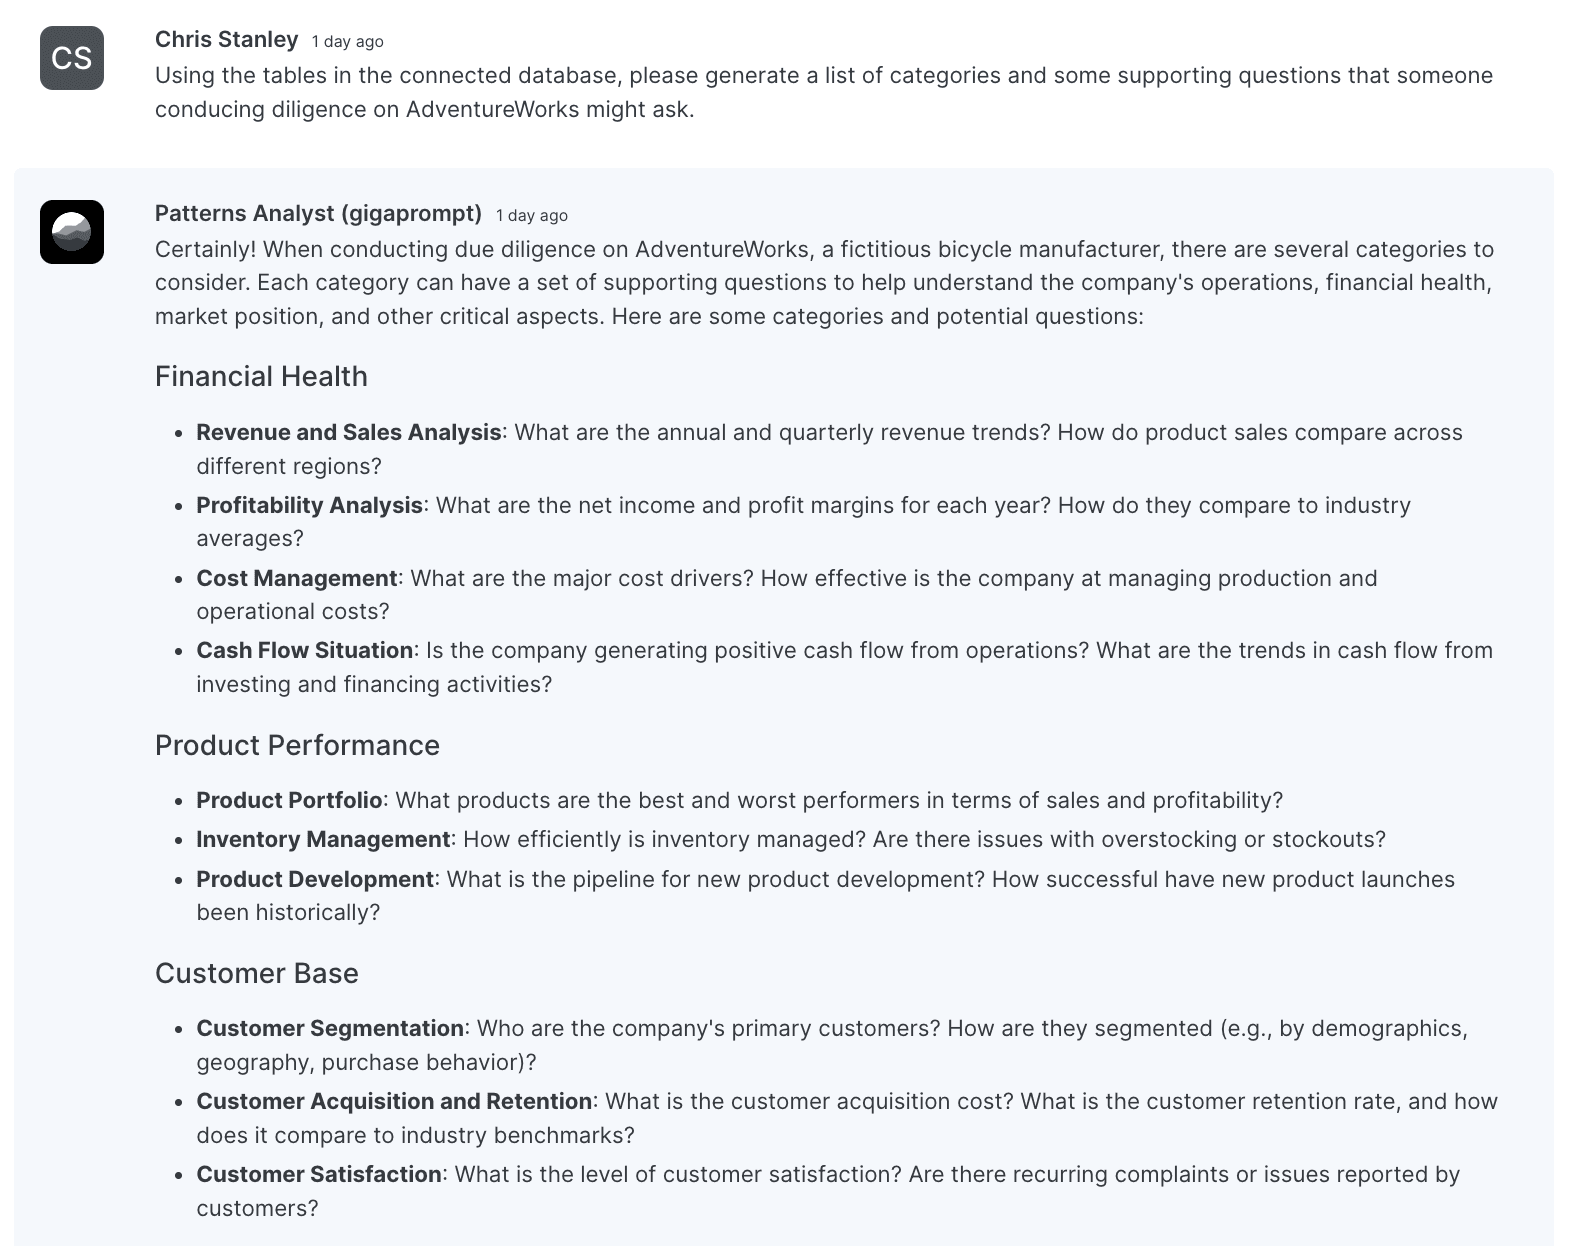
Without further ado, the first prompt I used to create an outline that I'd then use to inspire specific data requests for our project:

Our AI Analyst meticulously analyzed the entire database to suggest an intuitive layout for your data room. Key focus areas include:
Financial Health
Product Performance
Customer Base
Operations and Supply Chain
Human Resources
Step 2: Generating Detailed Requests
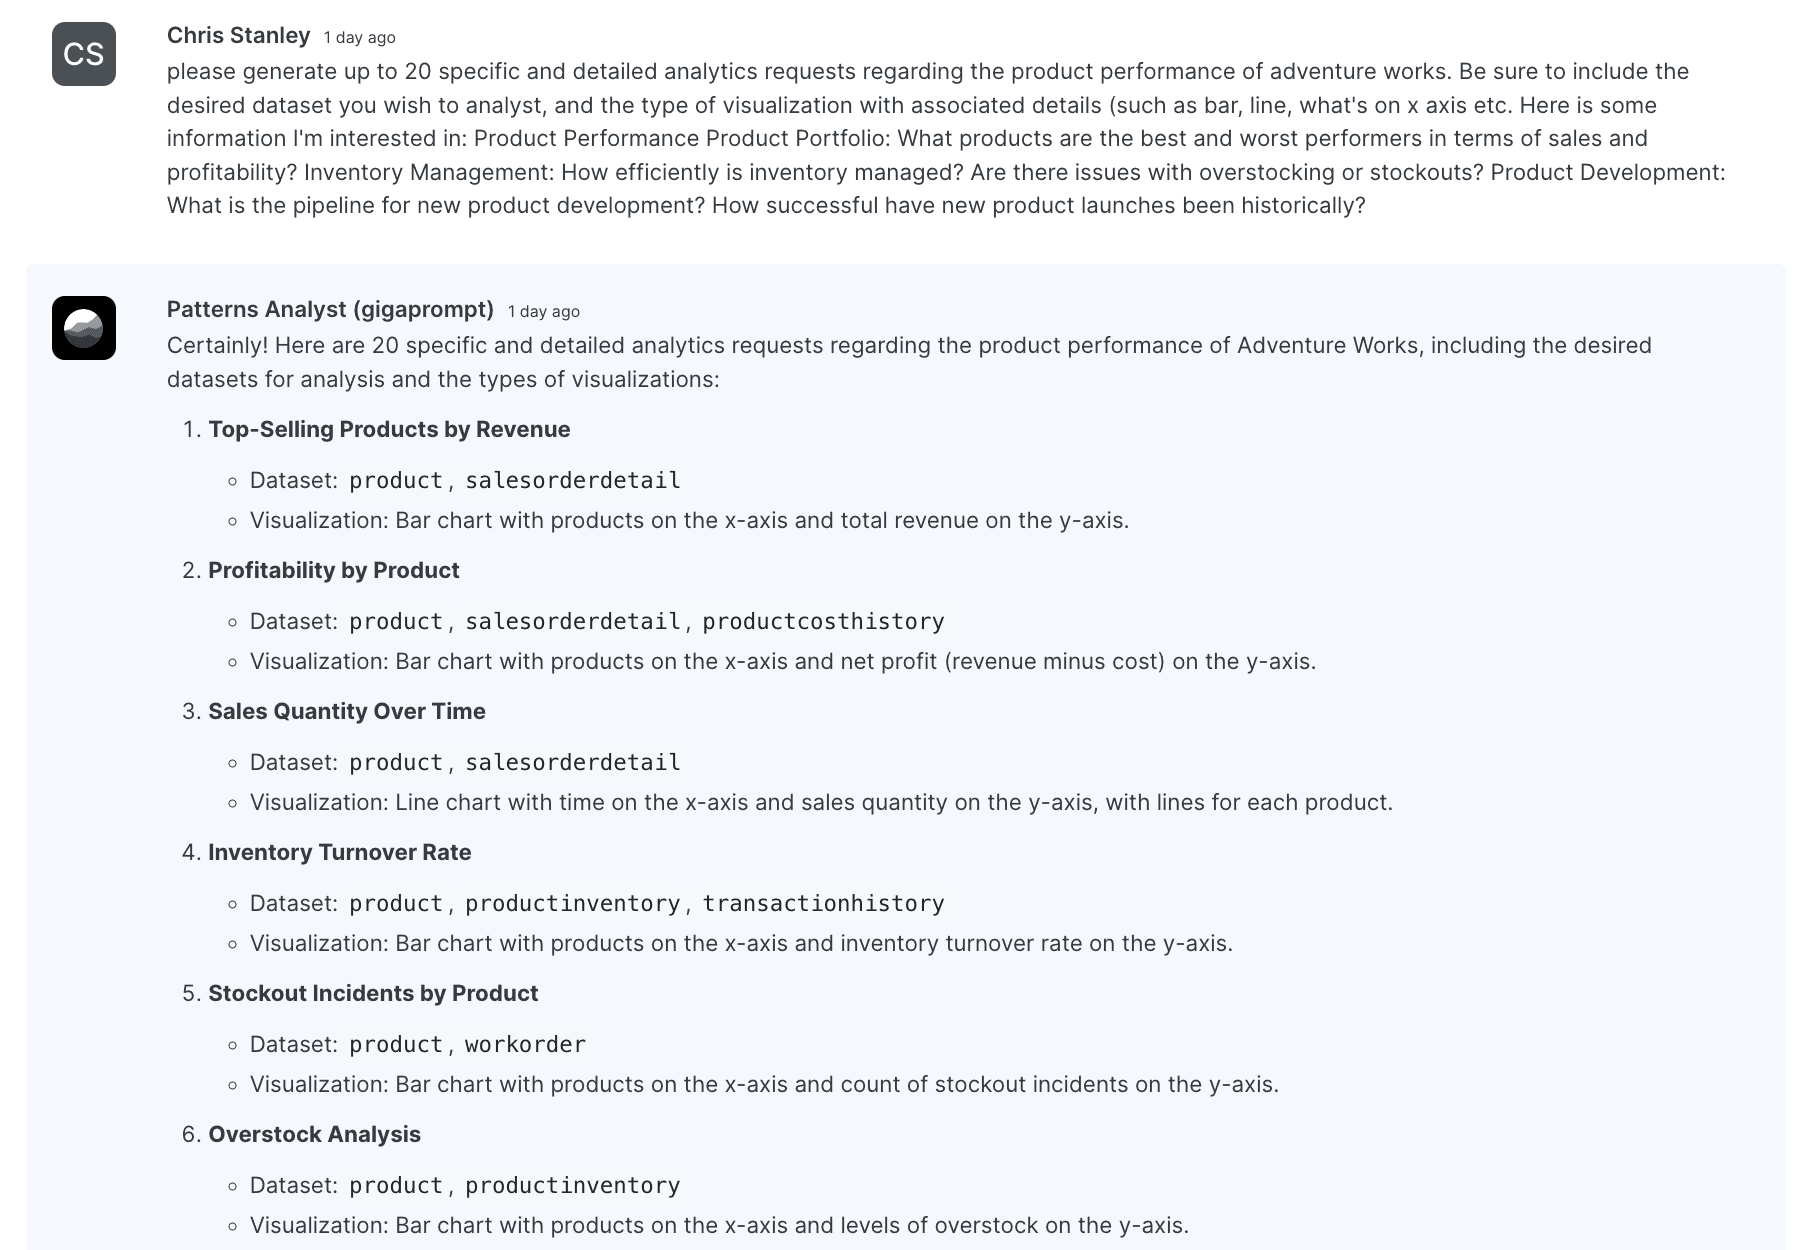
Next, we use the initial framework to formulate 20 distinct analytics requests per category, I ensure the requests specify the desired data set and its corresponding visualization. This critical phase, while swift, necessitated a thorough review to reduce redundancies and enhance details, boiling down 100 queries to 47.

Step 3: Performing the Analysis

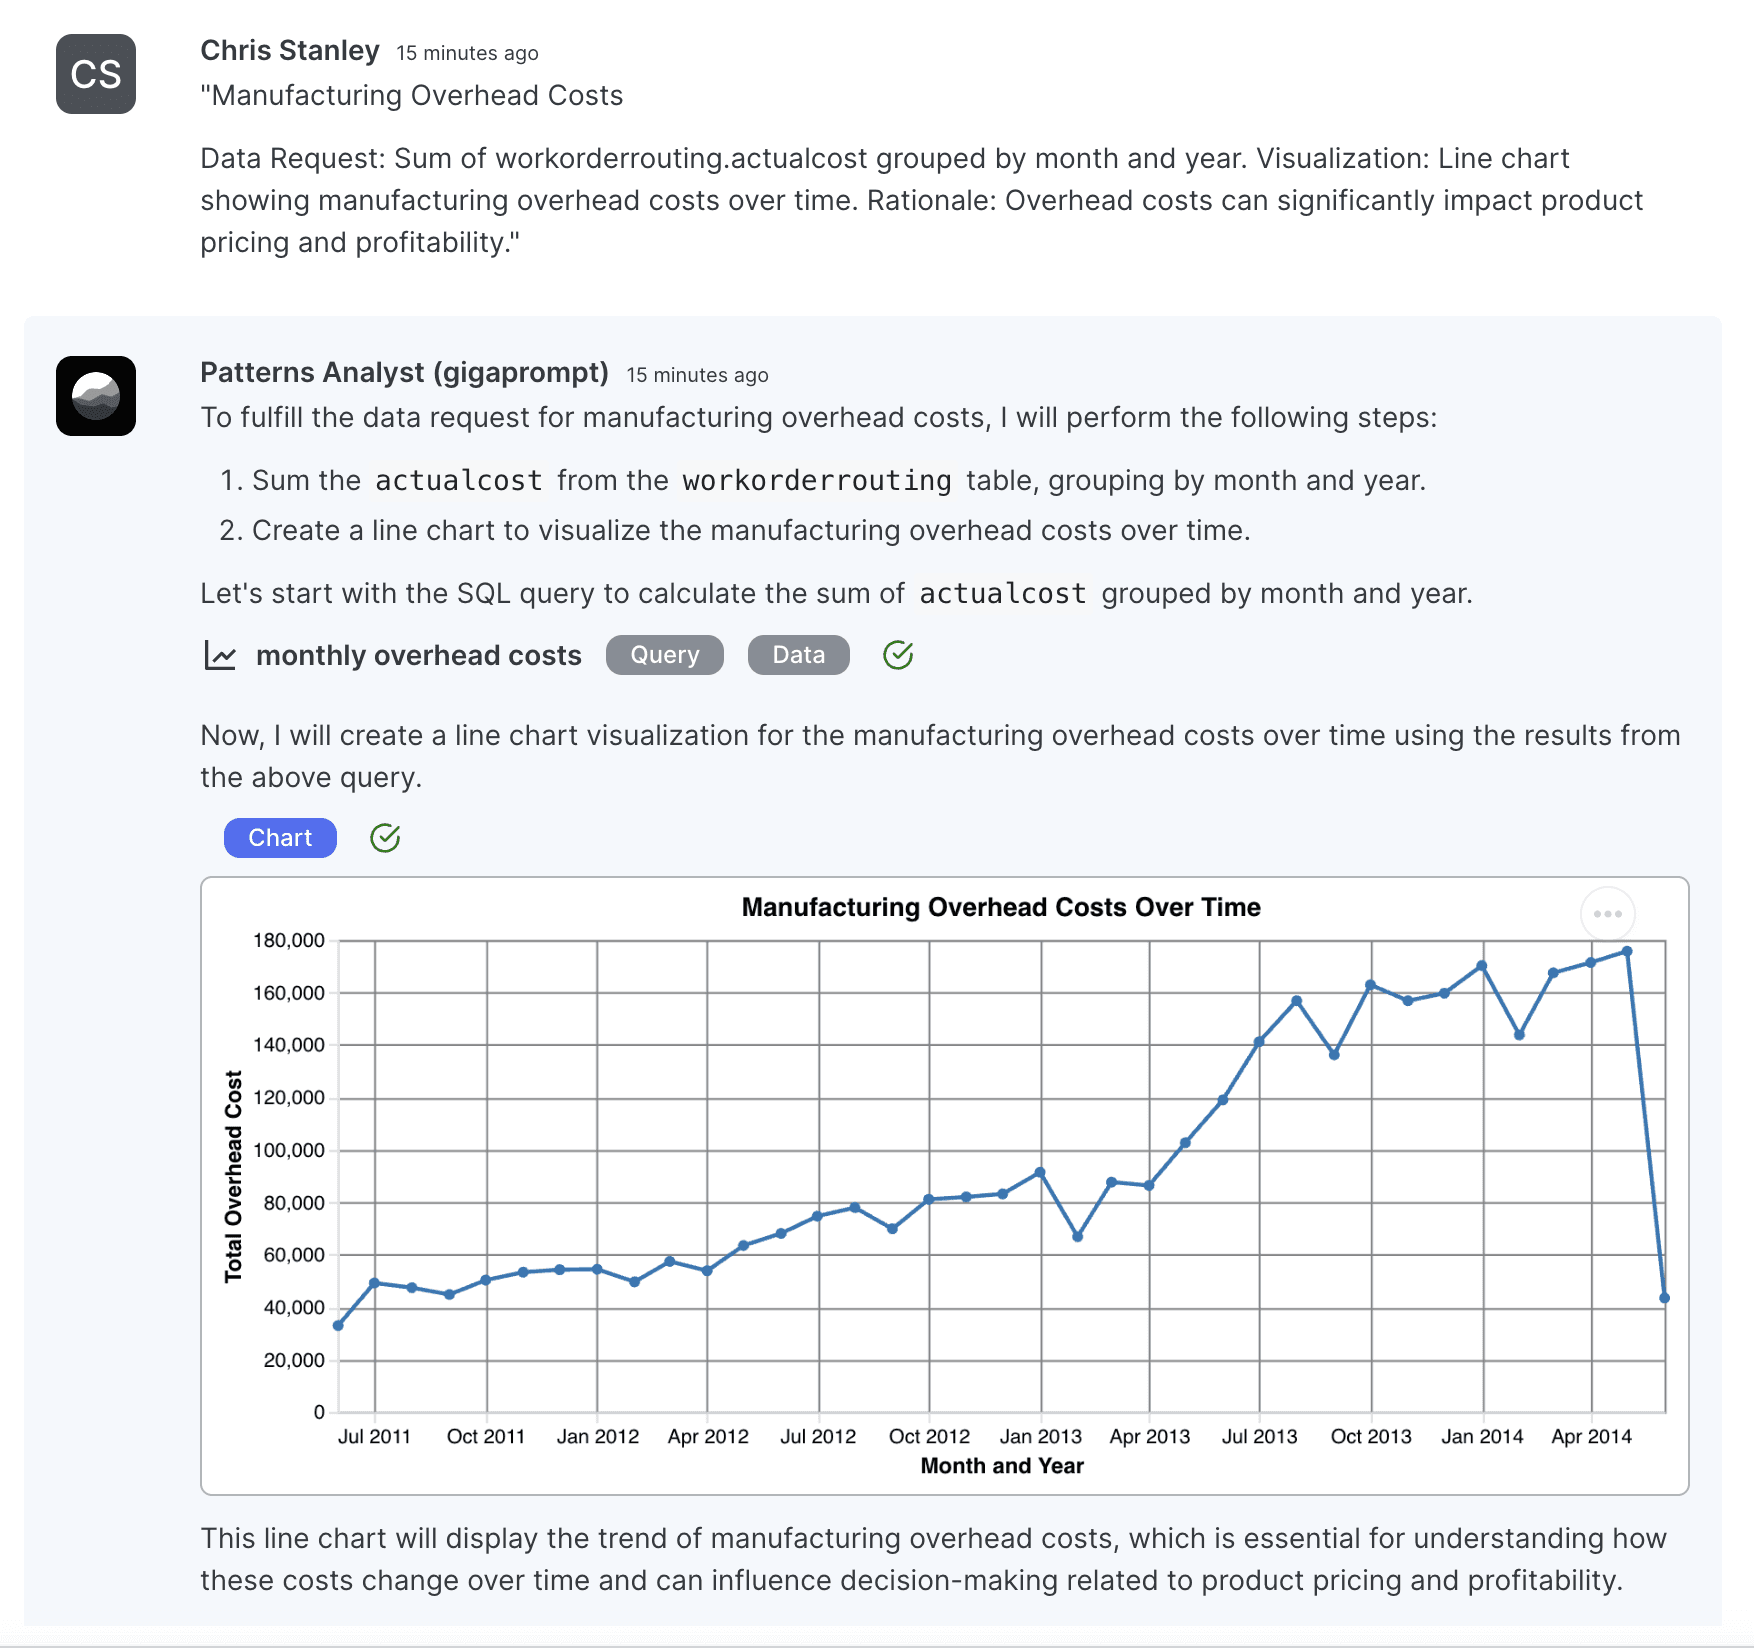
These 47 refined requests were then processed through our AI, organized via a Google sheet. While some needed further clarification, most were accurately addressed on the first attempt. We didn’t, but can optionally fine-tune our AI Analyst to improve first response performance, you can read more about that here.
Step 4: Synthesizing and Distributing Insights
Depending on the purpose of your data room and audience you might want to share the generated information through a number of different channels. I love google sheets and so do VCs, so figured that would be the best output mechanism for this faux data room.
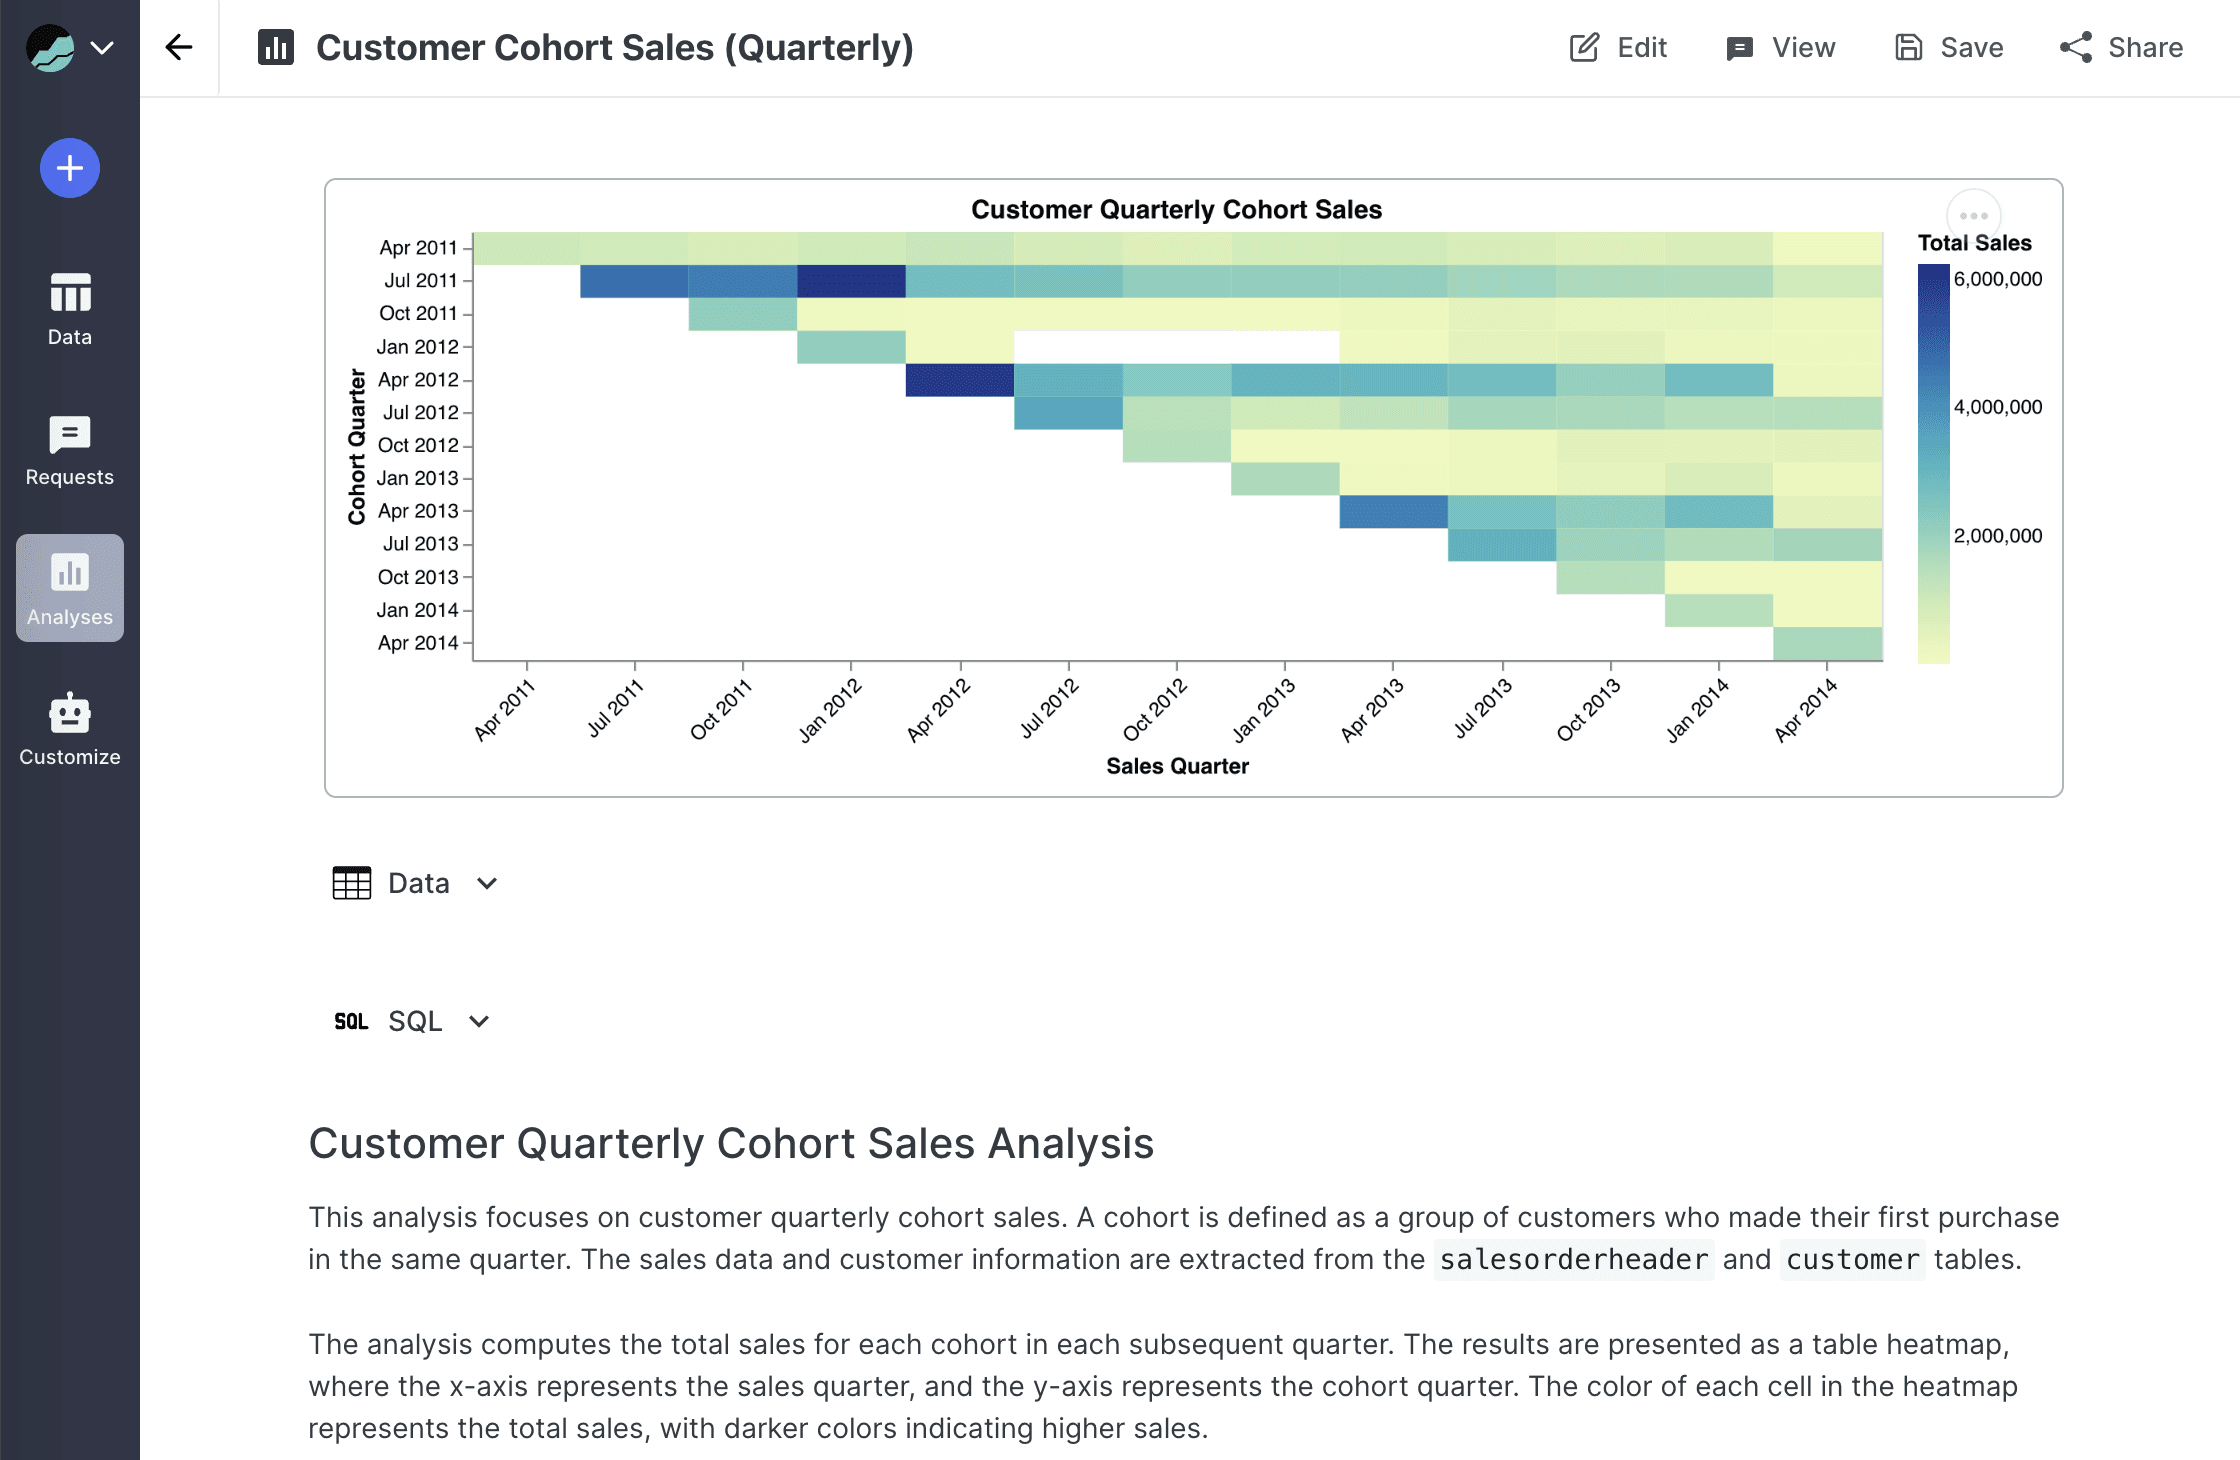
Alternatively you can use dedicated dashboards in Patterns, like this one here.
Export to a slide deck.
Or just give them access to the AI so they can self-serve their own data requests. Don't worry, you can see everything they ask and correct the AI's answers if they look off!
Analytics in natural language
Generate an investor-grade data room in 90 minutes with GPT4
Turn a basic database into an attractive showcase for investors with Patterns, a generative analytics tool. See how AdventureWorks, a fictional bicycle company, transformed their simple 92-table database into a comprehensive data suite in just 90 minutes. The process involves outlining research, generating specific data requests, analyzing with AI, and sharing insights through platforms like Google Sheets, dashboards, or slide decks.
Chris Stanley
·
January 14, 2024

This blog is for anyone looking to generate a ton of data intelligence on their company in a very short amount of time. I demonstrate how to do this using Patterns, our generative analytics product, and a series of prompts to create a comprehensive analytics suite. Our goal? To turn a basic database into an insightful, investor-attracting data showcase.
Our case study centers on AdventureWorks, a fictional company in the bicycle retail and manufacturing sector. We started with their straightforward 92-table production Postgres database, encompassing tables like orders, products, and employees. Within 90 minutes, we transformed this raw data into nearly 50 insightful analyses. So tell me, would you invest in AdventureWorks?
Discover the Results:
Click here to view the AdventureWorks generated data room (also embedded below)
Sign up here to demo Patterns with the AdventureWorks AI Analyst
Steps to prompt a data room
Generate a research outline
Use your outline to generate specific requests
Use your specific requests to generate the actual analyses
Synthesize and serve the analyses via AI chat or reports
Step 1 - Generate a research outline
Without further ado, the first prompt I used to create an outline that I'd then use to inspire specific data requests for our project:

Our AI Analyst meticulously analyzed the entire database to suggest an intuitive layout for your data room. Key focus areas include:
Financial Health
Product Performance
Customer Base
Operations and Supply Chain
Human Resources
Step 2: Generating Detailed Requests
Next, we use the initial framework to formulate 20 distinct analytics requests per category, I ensure the requests specify the desired data set and its corresponding visualization. This critical phase, while swift, necessitated a thorough review to reduce redundancies and enhance details, boiling down 100 queries to 47.

Step 3: Performing the Analysis

These 47 refined requests were then processed through our AI, organized via a Google sheet. While some needed further clarification, most were accurately addressed on the first attempt. We didn’t, but can optionally fine-tune our AI Analyst to improve first response performance, you can read more about that here.
Step 4: Synthesizing and Distributing Insights
Depending on the purpose of your data room and audience you might want to share the generated information through a number of different channels. I love google sheets and so do VCs, so figured that would be the best output mechanism for this faux data room.
Alternatively you can use dedicated dashboards in Patterns, like this one here.
Export to a slide deck.
Or just give them access to the AI so they can self-serve their own data requests. Don't worry, you can see everything they ask and correct the AI's answers if they look off!
Analytics in natural language
Generate an investor-grade data room in 90 minutes with GPT4
Turn a basic database into an attractive showcase for investors with Patterns, a generative analytics tool. See how AdventureWorks, a fictional bicycle company, transformed their simple 92-table database into a comprehensive data suite in just 90 minutes. The process involves outlining research, generating specific data requests, analyzing with AI, and sharing insights through platforms like Google Sheets, dashboards, or slide decks.
Chris Stanley
·
January 14, 2024

This blog is for anyone looking to generate a ton of data intelligence on their company in a very short amount of time. I demonstrate how to do this using Patterns, our generative analytics product, and a series of prompts to create a comprehensive analytics suite. Our goal? To turn a basic database into an insightful, investor-attracting data showcase.
Our case study centers on AdventureWorks, a fictional company in the bicycle retail and manufacturing sector. We started with their straightforward 92-table production Postgres database, encompassing tables like orders, products, and employees. Within 90 minutes, we transformed this raw data into nearly 50 insightful analyses. So tell me, would you invest in AdventureWorks?
Discover the Results:
Click here to view the AdventureWorks generated data room (also embedded below)
Sign up here to demo Patterns with the AdventureWorks AI Analyst
Steps to prompt a data room
Generate a research outline
Use your outline to generate specific requests
Use your specific requests to generate the actual analyses
Synthesize and serve the analyses via AI chat or reports
Step 1 - Generate a research outline
Without further ado, the first prompt I used to create an outline that I'd then use to inspire specific data requests for our project:

Our AI Analyst meticulously analyzed the entire database to suggest an intuitive layout for your data room. Key focus areas include:
Financial Health
Product Performance
Customer Base
Operations and Supply Chain
Human Resources
Step 2: Generating Detailed Requests
Next, we use the initial framework to formulate 20 distinct analytics requests per category, I ensure the requests specify the desired data set and its corresponding visualization. This critical phase, while swift, necessitated a thorough review to reduce redundancies and enhance details, boiling down 100 queries to 47.

Step 3: Performing the Analysis

These 47 refined requests were then processed through our AI, organized via a Google sheet. While some needed further clarification, most were accurately addressed on the first attempt. We didn’t, but can optionally fine-tune our AI Analyst to improve first response performance, you can read more about that here.
Step 4: Synthesizing and Distributing Insights
Depending on the purpose of your data room and audience you might want to share the generated information through a number of different channels. I love google sheets and so do VCs, so figured that would be the best output mechanism for this faux data room.
Alternatively you can use dedicated dashboards in Patterns, like this one here.
Export to a slide deck.
Or just give them access to the AI so they can self-serve their own data requests. Don't worry, you can see everything they ask and correct the AI's answers if they look off!